This full article is available to paid subscribers only:
I want to begin this article by stressing that I really don’t care about “lynching.”
It is not an interesting / relevant topic, and I especially never cared because I am Canadian and in the entire history of Canada, there was only one lynching, in 1884, and that was done by an American.
Race-obsessed Americans might think this is callow, but let’s put it this way: I give as much consideration to American lynchings that happened 200+ years ago as the typical American gives to lynchings in Rajasthan that happened this past summer.
It is much to my chagrin, then, that I keep being dragged into writing about lynching scandals in academic economics. Lynching has nothing to do with economics. Nonetheless, it is being shoved down the profession’s throat at every turn, and if you’re an academic economist, you’re not allowed to notice this.
First I wrote about lynching research because Lisa Cook’s career was based on fraudulent lynching research, and nobody in the media would report on it — perhaps because they didn’t know about it; perhaps because they were afraid of questioning a woke sacred cow. So when Joe Biden nominated Lisa Cook to the Federal Reserve System’s Board of Governors based on her fake lynching research (which was spun as “monetary economics”), I broke the scandal for the Daily Caller News Foundation:
The top EJMR thread of September was about lynching… Woke paper in AEJ applied with just about the worst phacked graph I've ever seen.
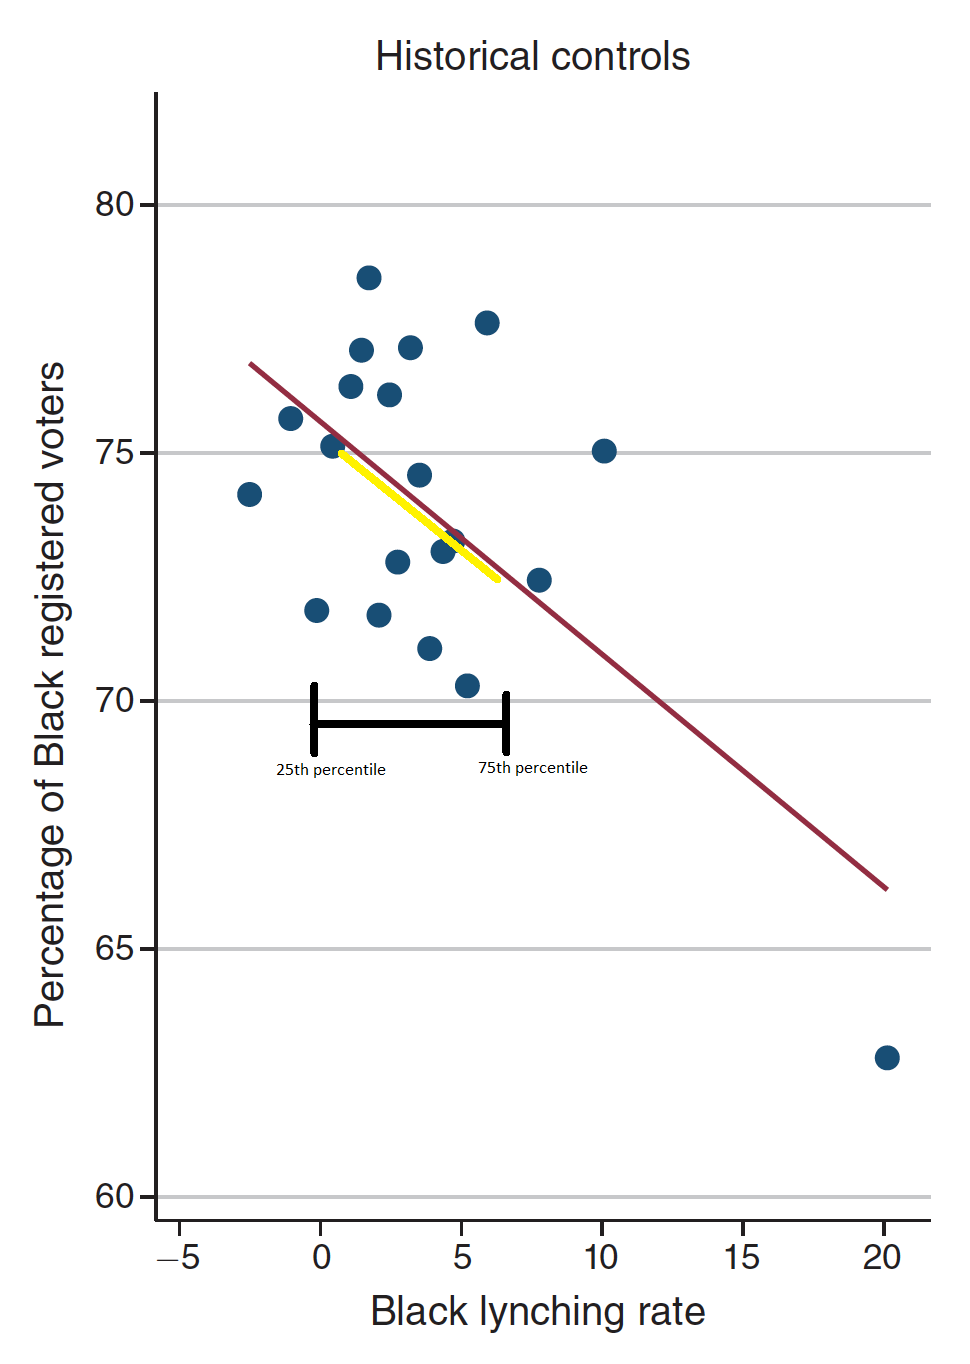
How bad is this “worst graphs I’ve ever seen” that was so outrageous it was the econ professions’ most talked about thread of the month? Judge for yourself:
What they are laughing at, of course, is that if you remove the outlier, you can draw any line-of-best-fit in the remaining cluster, and any of these lines will fit the data equally as well as every other line:
This is especially egregious because the author’s final conclusion in her paper, Historical Lynchings and the Contemporary Voting Behavior of Blacks, is that "moving from the twenty-fifth percentile of lynching rates to the seventy-fifth percentile results in a 2.7 percent drop in voter registration rates among Blacks.“
There is plainly no effect in that range. So, the author’s final conclusion is wrong.
I drew a yellow line in Microsoft Paint to show what this 2.7% drop from the 25th to 75th percentile looks like:
The author of this paper is Dr. Jacohva WIlliam, assistant professor at GWU, otherwise known as “The Beyoncé of economics” according to this PhD student at Harvard.


How does the “Beyoncé of economics” “prove” with “science” her conclusion? By torturing/twisting the data to get statistical significance, of course… otherwise known as p-hacking.
P-Hacking by Binning
The first thing you need to know about this now-infamous chart is that while it may appear to only have 22 observations — there are 22 dots on the plot, right? — the dataset in question actually has 267 observations. The author aggregated these 267 datapoints into 22 higher level datapoints because it was convenient, without any real statistical justification.
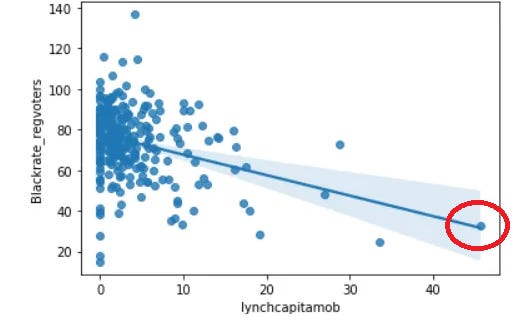
I downloaded the author’s data and replicated the chart. This is what it looks like when it is not binned:
It’s immediatiely obvious that her results are being driven by a few outliers which were previous obscured by the binning. The binning creates the impression that there are lots of outliers, thereby undercutting the claim that they are truly outliers.
Let’s drill down into the outliers — things are even worse than they appear. These 5 counties are the 5 most extreme datapoints:
These 5 counties have populations of roughly 39k, 29k, 37k, 45k, 16k… this adds up to ~176,000 people. These ~176,000 people in these 5 heavily-white counties are given more weight than the millions of people in heavily-black Atlanta.
It gets even worse if we dig a bit more. Let’s isolate, for example, the rightmost point, Dade County, GA,
Dade county is 0.87% black, and population 16,000.
Fulton county is 43% black, and a population of 1,052,000.
Yet all counties are given equal weight, precisely to make lynching look much more common than it was. So the results are not driven by an outlier, but by a subsample of counties that are very different from the rest of the population. If you re-run this analysis using nominal values rather than per-capita values, the results disappear.
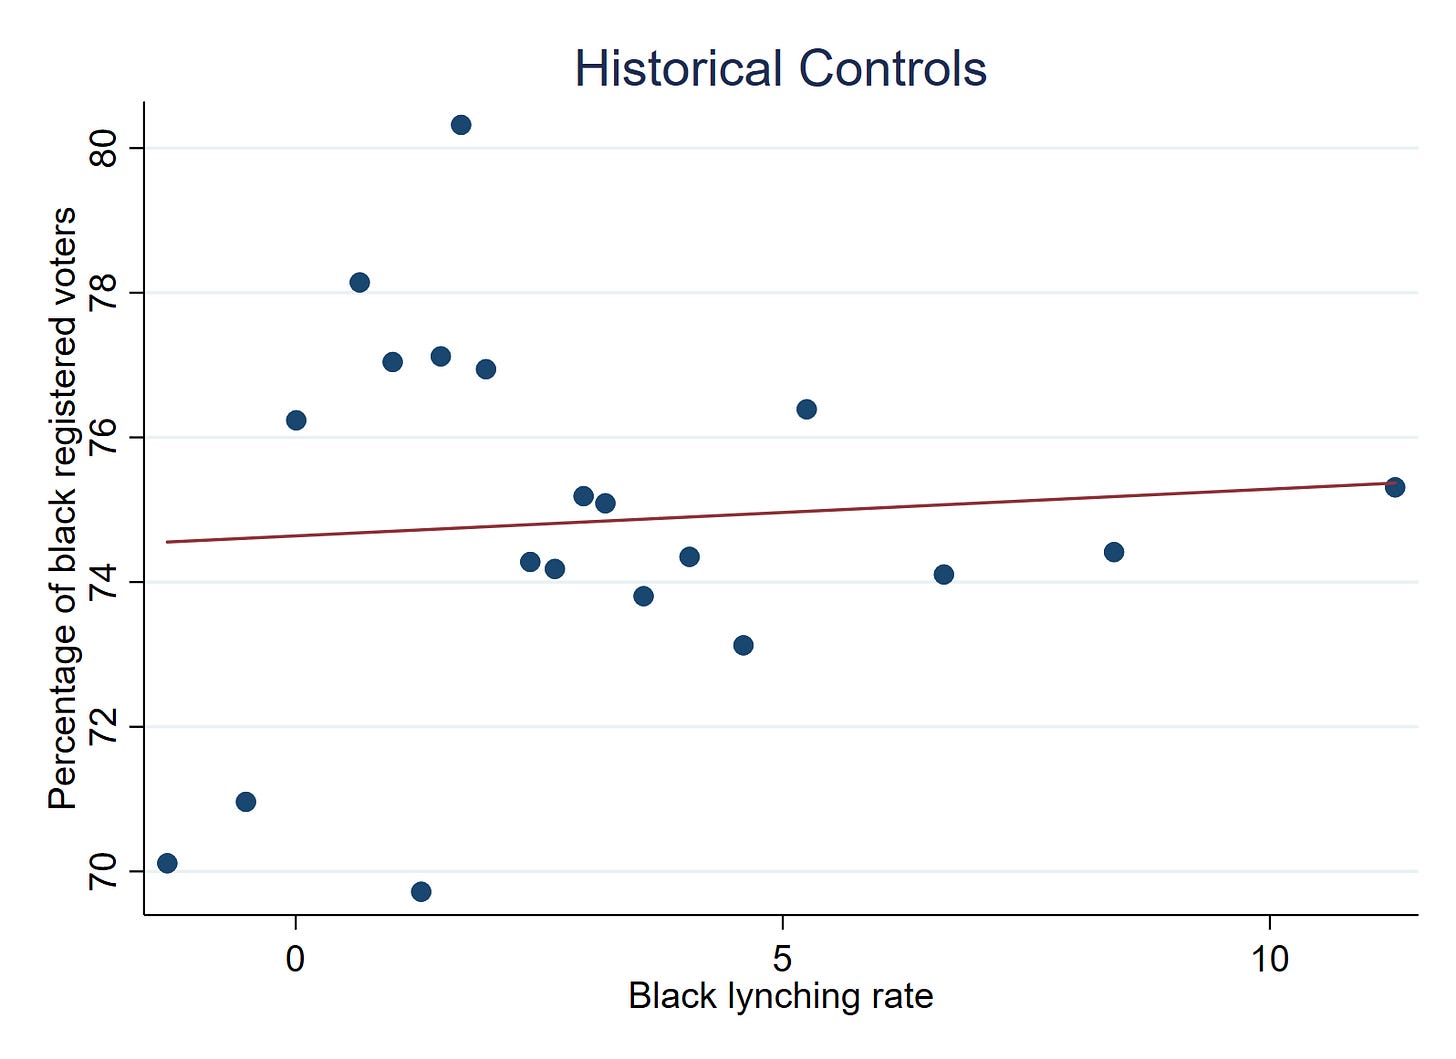
The results also disappear if you remove the 5 outlier counties. Notice how, when they are removed and disaggregated, the line of best fit goes from “very steep” to “basically flat” — meaning her results don’t survive having 1.8% (5/267) of the data dropped.
That still isn’t enough — dropping 1.8% of the data is actually being charitable to the author. Typically, a result is only considered to be “robust” if it holds after 5% of observations (13 of 267, in this case) are dropped. So, let’s drop 5% of outliers, and to top it off, let’s re-bin it, just like the author did! The results then not only disappears, but becomes positive.
These concerns about robustness are actually addressed by the author in footnote 31 of the paper:
The negative relationship remains when the group of outliers is removed from the sample.
In what sense does the relationship “remain” when outliers are removed? If the results were actually robust to removing the outliers, the associated regression results/tables would be reported in the paper.
The Clustering Clusterfuck
"Note: Standard errors are in parentheses and are clustered at the county level."
The observations are counties!
It is telling that the author wrote a paper in which # clusters = N.
Falsified Falsification Test
One commenter points out: You guys haven't even really dug into the data. Check the falsification test for white lynching rates. The zeroes are because she includes counties with zero white lynchings (most of them) in that spec, unlike for fig 5 or the corresponding headline regression. Talk about baking your results in.
Conclusion
Dr. Williams concludes her paper by writing, “this research has important policy implications.”
“Has policy implications”?
Really? What are they? Stop lynching people?
Lol, as if lynching is a real problem in 2022.
Brandon thinks it is. He just signed legislation that will solve this totally-real-problem-that-definitely-exists.
Needless to say, he’s putting on this performance with the legislation purely to pander to black people. How stupid does he think they are? I would be insulted.
I guess this is the same administration that fell hook-line-and-sinker for Jussie Smullet’s lynching hoax… so maybe they aren’t pandering, maybe they are genuinely stupid and believe lynching is a modern problem that needs a modern solution.
Jussie Smollet did a great job drawing attention to this important cause, just like Jhacova Williams is doing now.


You know what, actually? Fuck it. Who cares. Nothing matters. Call this lynching paper “monetary policy” and give Jhacova William a seat on the Fed Board next to Lisa Cook.
Give these lynching experts, who don’t understand basic econometrics — or worse, who do understand basic econometrics but pretend not to, for political gain — control of the national money printer.
What could go wrong?


Great analysis. Unfortunately, the folks pushing this bullshittery do not care about facts or logic, and they've convinced a significant chunk of the population (and worse, a large percentage of voters, living and deceased) to disregard facts and logic and to wear their wilful ignorance and motivated reasoning as a badge of honor. We need a great reset, just not the one those clowns are trying to engineer. Some Nuremberg trials of the con-artists behind the plandemic and the 2020 riots and the whole BLM grift would be a great start.
Thanks for another excellent challenge to appalling use of data.
The first graph alone would not have passed muster with a "hard" scientist. Learning that the points were aggregated into bins, and that the bins were not commensurate in characteristics, was just icing on a rotten cake.
This farcical paper passed peer review? What low caliber of review if so.
What you are doing is important.